
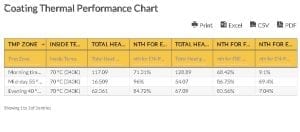
The Coating Thermal Performance Chart (Table 1) shows various temperatures for the different days and the pipe coating studied in the Omani desert region.
Table 2 shows the physical properties of crude oil from five Omani locations. It is useful for determining the temperature effects on coating and the best coating for pipes on certain temperature conditions.
Coating Thermal Performance Table Analysis
The Table for Coating Thermal Performance (Table 1) details columns for temperature zones (in rows), temperatures in the surface of coating for varying temperature zones, and the temperature for the inside pipeline. The full section or inside pipeline temperature (Celsius and Kelvin) remains constant while the surface temperature on coating increased. The temperature peaked at mid-day and dropped to negative 10 degrees Celsius in the evening.
Both types of coatings (EN-P and FBE) slow down the heat transfer rate and allow effective insulation. Thermal coating is useful for reducing or preventing thermal stress and thus, increases the pipe’s life service. The EN-P coating shows lower rates of heat transfer compared to the FBE coating.
The Table for Crude Oil Properties (Table 2) shows the physical property (density) of crude oil samples at various Omani locations. The five columns show the temperature and the five Omani locations – Erad, Oman Export, Receive line, Mabruk, and Zal-41. The table shows that the crude oil from Erad is the heaviest and that the lightest is from Zal 41. An increment in temperature decreases each of the oil sample’s densities.
Coating Thermal Performance Chart
| Tmp Zone | Inside Temp. | Total Heat Generated in W/m2 for EN-P coating | nth for EN-P coating against uncoated pipe | Total Heat generated in W/m2 for FBE coating | nth for FBE Coating against uncoated pipe | nth for EN-P Coating against FBE Coating | |
|---|---|---|---|---|---|---|---|
| wdt_ID | Tmp Zone | Inside Temp. | Total Heat Generated in W/m2 for EN-P coating | nth for EN-P coating against uncoated pipe | Total Heat generated in W/m2 for FBE coating | nth for FBE Coating against uncoated pipe | nth for EN-P Coating against FBE Coating |
| 1 | Morning time 35 °C (308k] | 70 °C (343K) | 117.09 | 71.31% | 128.89 | 68.42% | 9.1% |
| 2 | Mid-day 55 °C [328K] | 70 °C [343K) | 16.509 | 96% | 54.07 | 86.75% | 69.4% |
| 3 | Evening 40 °C (343K) | 70 °C (343K) | 62.361 | 84.72% | 67.09 | 83.56% | 7.04% |
table.wpDataTable { table-layout: fixed !important; }
table.wpDataTable td.numdata { text-align: right !important; }
/* th background color */
.wpdt-c .wpDataTablesWrapper table.wpDataTable thead th,
.wpdt-c .wpDataTablesWrapper table.wpDataTable thead th.sorting {
background-color: #f7c54b !important;
background-image: none !important;
}
/* th border color */
.wpdt-c .wpDataTablesWrapper table.wpDataTable thead th,
.wpdt-c .wpDataTablesWrapper table.wpDataTable thead th.sorting {
border-color: #6b6b6b !important;
}
/* th font color */
.wpdt-c .wpDataTablesWrapper table.wpDataTable thead th {
color: #333333 !important;
}
.wpdt-c .wpDataTablesWrapper table.wpDataTable thead th.sorting:after,
.wpdt-c .wpDataTablesWrapper table.wpDataTable thead th.sorting_asc:after {
border-bottom-color: #333333 !important;
}
.wpdt-c .wpDataTablesWrapper table.wpDataTable thead th.sorting_desc:after {
border-top-color: #333333 !important;
}
/* th active/hover background color */
.wpdt-c .wpDataTablesWrapper table.wpDataTable thead th.sorting_asc,
.wpdt-c .wpDataTablesWrapper table.wpDataTable thead th.sorting_desc,
.wpdt-c .wpDataTablesWrapper table.wpDataTable thead th.sorting:hover {
background-color: #ebebeb !important;
background-image: none !important;
}
.wpdt-c .wpDataTablesWrapper table.wpDataTable thead tr:nth-child(2) th {
overflow: visible;
}
Crude Oil Properties Chart
| tT(°C) | Erad | Oman Export | Receive Line | Mabruk | Zal-41 | |
|---|---|---|---|---|---|---|
| wdt_ID | tT(°C) | Erad | Oman Export | Receive Line | Mabruk | Zal-41 |
| 1 | 20 | 933,302 | 855,019 | 851,414 | 824,753 | 817,802 |
| 2 | 25 | 929,939 | 851,503 | 847,930 | 821,182 | 814,311 |
| 3 | 30 | 926,586 | 848,018 | 844,441 | 817,776 | 810,890 |
| 4 | 35 | 923,262 | 844,488 | 840,904 | 814,370 | 807,468 |
| 5 | 40 | 920,123 | 840,983 | 837,395 | 810,967 | 804,047 |
| 6 | 45 | 916,973 | 837,493 | 833,877 | 807,561 | 800,618 |
| 7 | 50 | 913,806 | 834,008 | 830,375 | 804,153 | 797,188 |
| 8 | 55 | 910,644 | 830,525 | 826,880 | 800,746 | 793,758 |
| 9 | 60 | 907,479 | 827,034 | 823,376 | 797,336 | 790,324 |
| 10 | 65 | 904,361 | 823,540 | 819,876 | 793,924 | 786,884 |
table.wpDataTable { table-layout: fixed !important; }
table.wpDataTable td.numdata { text-align: right !important; }
/* th background color */
.wpdt-c .wpDataTablesWrapper table.wpDataTable thead th,
.wpdt-c .wpDataTablesWrapper table.wpDataTable thead th.sorting {
background-color: #f7c54b !important;
background-image: none !important;
}
/* th border color */
.wpdt-c .wpDataTablesWrapper table.wpDataTable thead th,
.wpdt-c .wpDataTablesWrapper table.wpDataTable thead th.sorting {
border-color: #6b6b6b !important;
}
/* th font color */
.wpdt-c .wpDataTablesWrapper table.wpDataTable thead th {
color: #333333 !important;
}
.wpdt-c .wpDataTablesWrapper table.wpDataTable thead th.sorting:after,
.wpdt-c .wpDataTablesWrapper table.wpDataTable thead th.sorting_asc:after {
border-bottom-color: #333333 !important;
}
.wpdt-c .wpDataTablesWrapper table.wpDataTable thead th.sorting_desc:after {
border-top-color: #333333 !important;
}
/* th active/hover background color */
.wpdt-c .wpDataTablesWrapper table.wpDataTable thead th.sorting_asc,
.wpdt-c .wpDataTablesWrapper table.wpDataTable thead th.sorting_desc,
.wpdt-c .wpDataTablesWrapper table.wpDataTable thead th.sorting:hover {
background-color: #ebebeb !important;
background-image: none !important;
}
.wpdt-c .wpDataTablesWrapper table.wpDataTable thead tr:nth-child(2) th {
overflow: visible;
}
Legend:
tT – Temperature Transducer
Coating Thermal Performance Chart: Definition of Terms
ASTM A106 B
ASTM A106 B refers to the standard pipe used in high-temperature environments. ASTM stands for American Society for Testing and Materials.
Stress Corrosion Cracking (SSC)
SSC refers to the crack formation growth that can cause unexpected structural failure in ductile metals such as metal pipes. Environment, metallurgy, and stress form the conditions that allow SSC.
Electroless Nickel Phosphorus (EN-P)
EN-P is a coating made by using a chemical bath that deposits nickel. The EN-P coating is resistant to corrosion and scratch.
Fusion Bonded Epoxy (FBE)
FBE is a powder-based coating with epoxy properties. It is used to protect and coat valves, steel pipeline, and piping connections. The epoxy derived its name from the “fusion bonding” process when the epoxy and the hardener react to form a solid material that adheres to the substrate.
Thermal Stress
Thermal stress refers to a change in the temperature of a material. A rapid change from cool to high temperature can cause cracking in some materials.
Go here if you are looking for the Corrosion Coating Comparison Chart.
The Oilfield Equipment related post Coating Thermal Performance Chart is from Flowtech Energy. Looking for Oilfield Equipment including New, Used, Remanufactured and Surplus Oilfield Supply, check out our inventory or call our toll free number at 877-645-6693 for more information.
From https://www.flowtechenergy.com/charts/coating-thermal-performance-chart/
